U.S. Application Activity Declines in Q3-2022 Compared to Q3-2021, but Remains Above Q3-2019
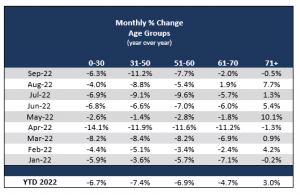
Growth focused on ages 71+
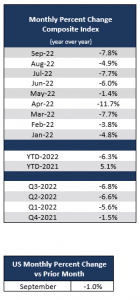
U.S. life insurance application activity finished Q3-2022 down -6.3% Year-to-Date (YTD) compared to Q3-2021. However, when taking a historical lookback, YTD activity was down -5.9% compared to Q3-2020 but up +2.6% compared to pre-COVID levels in Q3-2019. On a Year-Over-Year (YOY) basis, September 2022 activity was down -7.8% compared to September 2021 and activity during Q3-2022 finished down -6.8% compared to activity during Q3-2021. Additionally, when comparing Q3-2022 to the previous quarter (Q2-2022), activity was flat at -0.03% in a pattern similar to last year, but in contrast to long term historical results where Q3 traditionally has lower activity than Q2.
.
.
Activity for ages 0-70 showed YOY declines in September, in the double digits for ages 31-50, while ages 71+ saw flat activity. On a quarterly basis, Q3-2022 saw YOY and YTD declines compared to Q3-2021 for ages 0-70 and growth for ages 71+. It is interesting to note that Q3-2022 represents the 6th consecutive quarter that ages 71+ has outpaced other age bands in quarterly YOY application activity.
September saw YOY declines for face amount up to and including $1M, growth for face amounts over $1M up to and including $5M, and flat activity for amount over $5M. When comparing activity during Q3-2022 to activity during Q3-2021 YOY, face amounts over $1M up to and including $5M saw flat activity while all other face amounts saw declines. When examining age bands for activity during Q3-2022 compared to activity during Q3-2021 YOY, ages 0-30 saw declines for face amounts up to and including $250K and growth for face amounts over $250K, in the double digits for face amounts over $2.5M. Age 31-50 saw declines for face amounts up to and including $1M and amounts over $5M, in the double digits for amounts up to and including $250K, and flat activity for other face amounts. Ages 51-60 saw declines for face amounts up to and including $1M, flat activity for amounts over $1M up to and including amounts $5M, and double-digit decline for amount over $5M. Ages 61-70 saw flat activity for amounts up to and including $250K and declines for all other face amounts, in the double digits for amounts over $2.5M. Ages 71+ saw growth for face amounts up to and including $250K, and declines for all other face amounts, in the double digits for amounts over $250K up to and including $5M.
All product types experienced YOY declines in September. Universal Life saw declines of -6.5%, Term Life of -7.6%, and Whole Life saw double-digit declines of -10.9%. Similarly, when comparing activity during Q3-2022 to activity during Q3-2021 YOY, all product types saw declines, in the double digits for Whole Life. When breaking down the Q3-2022 to Q3-2021 YOY comparison by age bands, only Universal Life for ages 71+ was at growth. All other age bands across all other product types were either flat or declined. Specifically, Term Life saw flat activity for ages 0-30 and 71+ while all other age bands saw declining activity. Universal Life saw declines for ages 0-60, in the double digits for ages 31-50, flat activity for ages 61-70, and growth for ages 71+. Whole Life saw declines for ages 0-70, in the double digits for ages 0-60, and flat activity for ages 61-70.
.